Introduction of ECG a Basic Idea about ECG with general description of 12 Leads
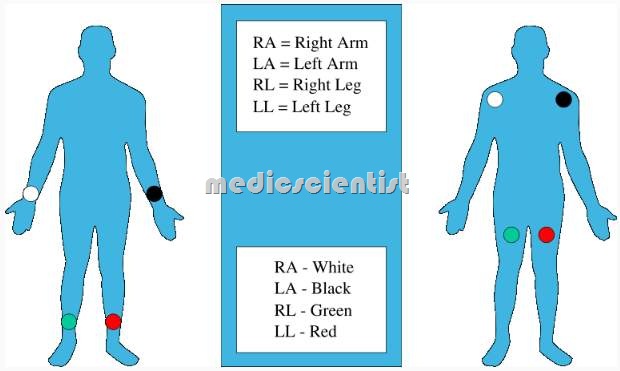
Connect leads:
- . RA (Red) to right arm
- • RL (Black) to right leg
- · LA (Yellow) to left arm
- · LL (Green) to left leg
Connect the precordial leads Vi – V 6 as follows:
- · Vi to the right of sternum in the 4th intercostal space
- · V2 to the left of the sternum in the 4th intercostal space
- · V3 midway between V2 and V4
- · V4 midclavicular line left fifth intercostal space
- · Vs and V6 in the same line as V4 in anterior and mid axillary lines respectively.
·
The 12 leads are:
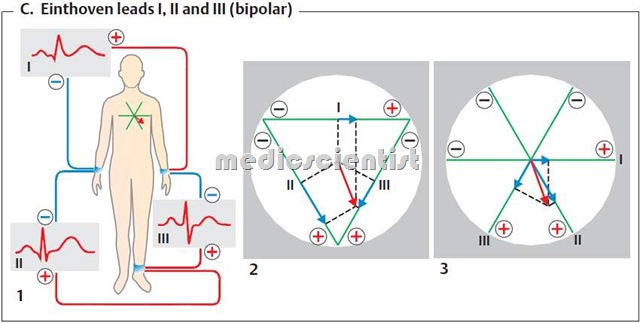
- – 3 standard limb leads L I, L II, L III
- – 3 augmented leads AVR, AVL, AVF
- – 6 precordial leads V1 to V6
Normal ECG consists of 12 leads recorded serially or simultaneously or in groups. In the above picture, 3 leads have been recorded at a time
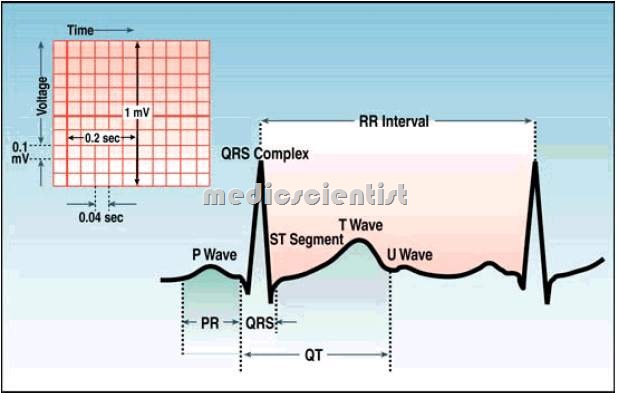
• Look at the waves and intervals in the ECG.
- The first wave is the P wave.
- The next tall and narrow wave and often consistin RS wave followin which is the T
- From the beginning of P wave to beginning of QRS is the PR interval.
- · From the beginning of Q to the end of T is the QT interval.
- · From beginning of QRS to the end of QRS is the QRS interval.
- · From the end of R to the beginning of T is the ST segment.
- 1 mm = 0.04 see
- 5 mm = 0.2 see
- 1 mm = 0.1 mv
On the ECG paper, time is represented in seconds horizontally and voltage is represented in millivolts vertically.
- · 1 small square is 0.04 s horizontally and 0.1 mv vertically, if the paper speed is 25 mm/s.
- · This means that 10 mm = 1 mv.
- · 5 small squares = 5 x 0.04 = 0.2 s.
- · 1 big square = 0.2 s, 5 big squares = 0.2 x 5 = 1 sec.
- This is a Basic idea about ECG, with a introduction to measuring ECG .


